Remix with Rovo in Confluence: Transform Your Data into Visuals

April 27, 2026
What is Remix with Rovo and how is it revolutionizing Confluence?
Confluence lovers, you are going to enjoy this update. Atlassian has clearly stated that pages with visual elements are twice as likely to be read. Therefore, formatting makes a complete difference in how we share information.
A few weeks ago, Atlassian introduced Remix with Rovo in Confluence. This powerful tool transforms any page content into attractive formats like charts and infographics. If you need expert guidance, explore our Atlassian professional services.
What can you do with Remix with Rovo?
Remix with Rovo offers a new way to visualize existing content. For instance, a data-heavy section can become a chart. A process description turns into an infographic. Specifically, you can:
- Convert bullet points into visual infographics.
- Create org charts from team tables.
- Generate editable diagrams from complex datasets.
- Produce interactive maps for market research.
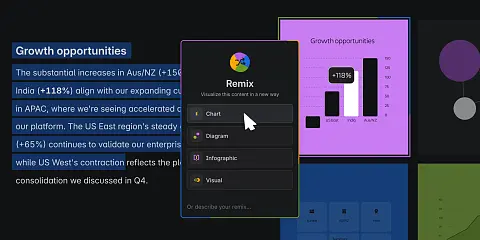
Visual Formats Powered by AI
When you select Remix, you will find these options:
- Chart: This feature lets you create a chart or table when your selection contains numerical data. You can choose from different options, such as a bar chart or a pie chart, if you know exactly how you want to visualize the information. Or you can ask Rovo to “Choose for you,” and it will generate the chart that best fits the selected data.
- Diagram: Create a visual representation of the relations. It could be a flowchart or a mind map. It depends on the content you've selected and how you want to present it.
- Infographic: Choose between modern or sketch styles, adding a much more visual element to your text content.
- Visualization: Create an interactive image that can enhance the information or presentation of your original work. For example: a timeline, a map, an organizational chart…
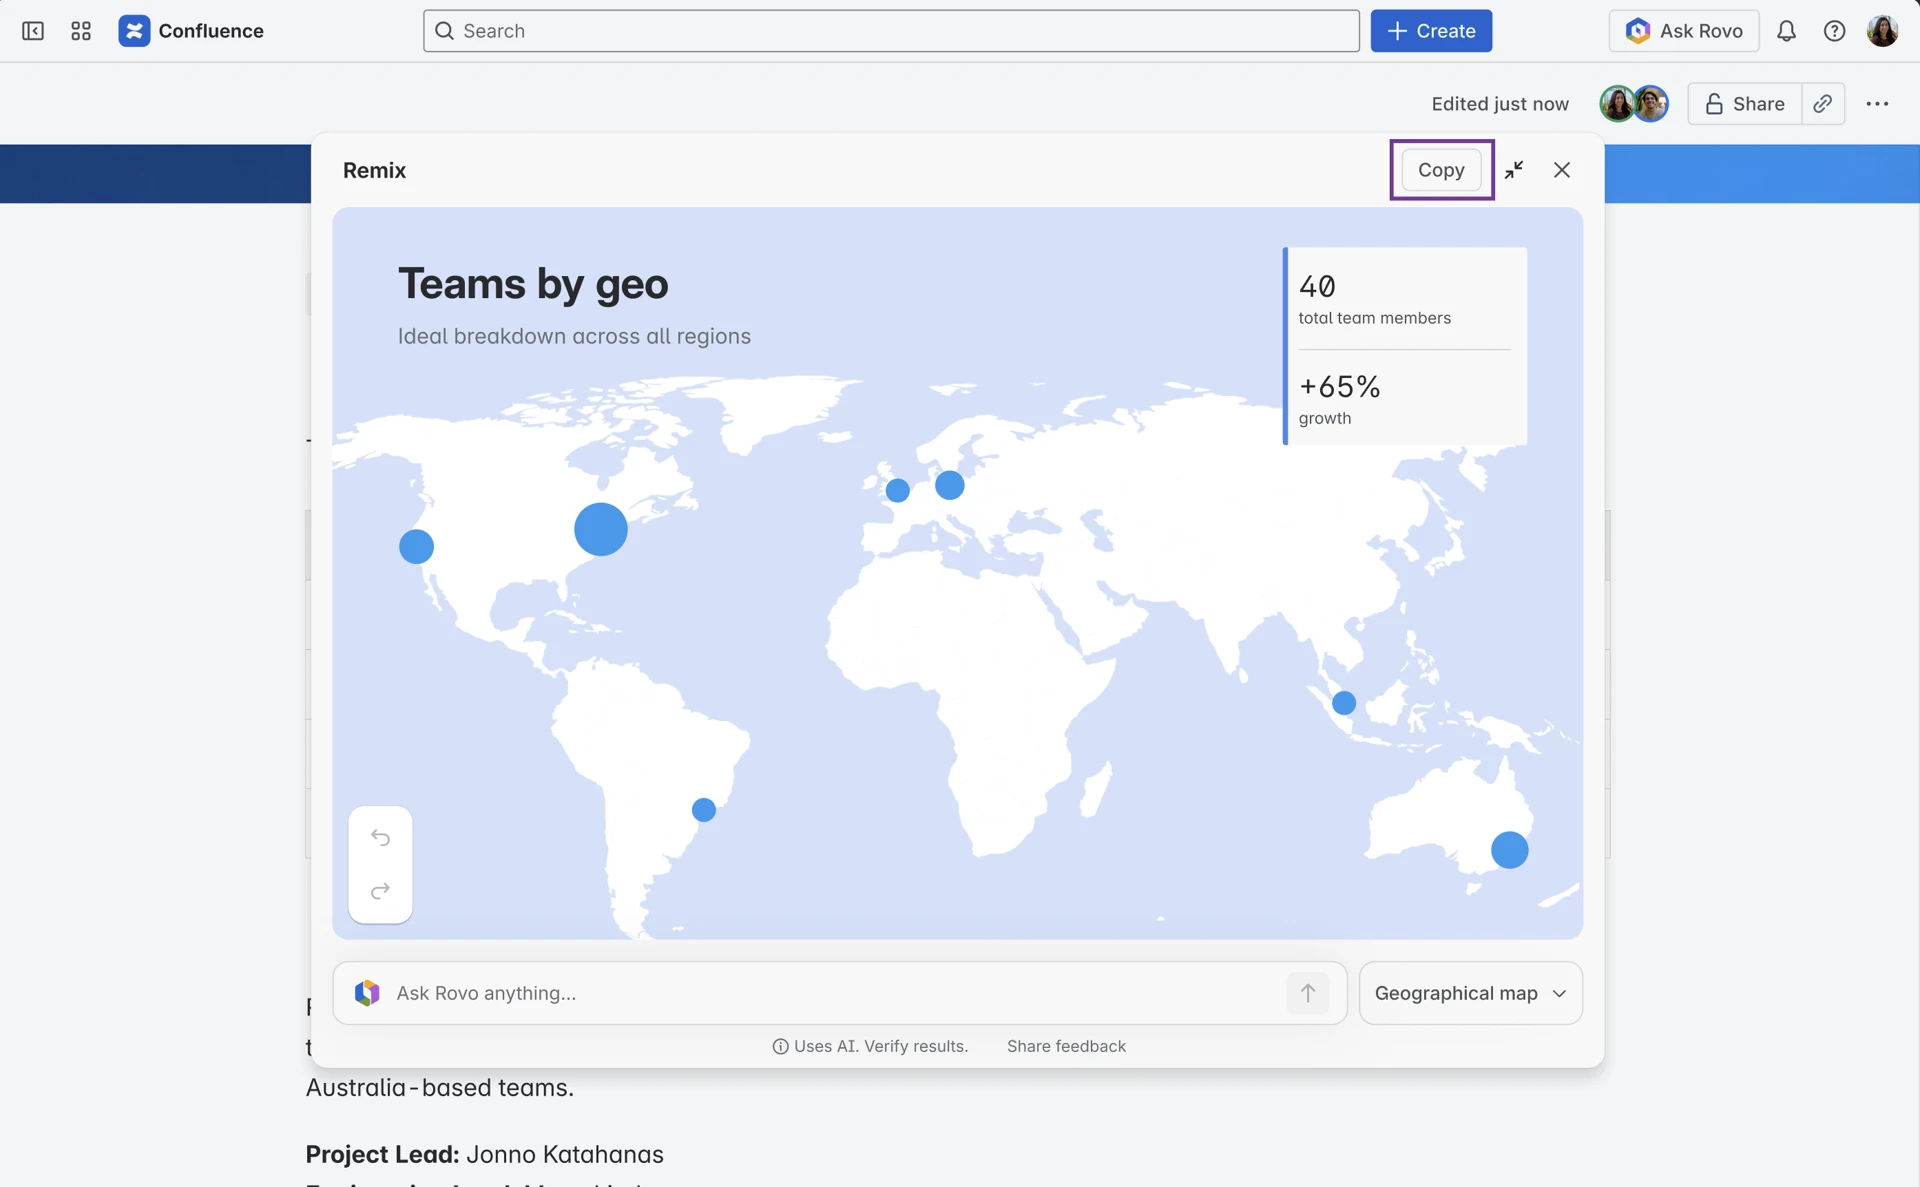
How to use Remix on your pages
There are three ways to access Remix. First, highlight content on a live doc to see the Remix button. Second, the menu appears while editing tables. Third, you can access it via the right sidebar near comments and Loom.
Once selected, Remix creates a preview. You can change the style or ask Rovo for specific revisions. When satisfied, click "+Add to page" to insert the visual layer. This enhances your cloud collaboration strategy significantly.
Key Facts about content integrity in Remix with Rovo
1. Remix is non-destructive: it never overwrites your page. Each Remix is an extra layer on top of the source, which remains intact as the original version. This way, there’s no need to create copies—just layers on top of the original design. 2. Remix analyzes the content: it always thoroughly analyzes a page’s content to suggest a solid initial version that you can then adjust. It offers ready-to-use formatting options (infographics, bar charts, etc.), or a free-form prompt so you can ask for exactly what you want, if you know what you’re looking for. 3. Remix doesn’t separate the content: Remix views appear directly on the page. It doesn’t separate the content. This way, anyone visiting the Confluence page can convert text into a chart and continue reading the rest of the text without losing context.
Remember, if you want to learn more about privacy and data security for Rovo Agents, here’s the complete guide.
When can you start using Remix with Rovo?
Remix is now available in open beta for Confluence Cloud customers who have Rovo enabled. If you don’t see it in your environment yet, it will appear in a few days with the first features available: infographics, diagrams, and charts. Atlassian will gradually add new formats.
If you need help getting the most out of these new AI features for your team, remember that at Sngular, as an Atlassian Platinum Solution Partner, we’d be happy to assist you. If you need expert guidance, explore our Atlassian professional services.
Our latest news
Interested in learning more about how we are constantly adapting to the new digital frontier?
Tech Insight
July 1, 2026
The New Era of Agentic Programming: Antigravity 2.0 and Sngular Gen

Tech Insight
June 25, 2026
Let Gemini Do It: Generative AI for Businesses on Google Cloud
Tech Insight
June 18, 2026
No Data, No AI: Agentic Data Cloud and Data Sovereignty

Tech Insight
June 16, 2026
Generative UI: When AI Architecture Builds the Interface, Not Just the Text